Disadvantaged National Results – Primary 2017
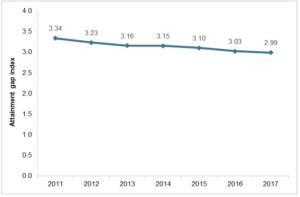
The DfE have confirmed that the gap between disadvantaged pupils and others, measured using the disadvantage gap index, has decreased in each of the last six years, narrowing by 1.3% in the latest year and 10.5% since 2011. This shows that, as well as more disadvantaged pupils reaching the expected standard in 2017, the average position of disadvantaged and other pupils in the attainment distribution has become closer together. Suggesting the overall Pupil Premium strategy is having an impact.
The DfE index has been in steady decline over the last 6 years:
Disadvantaged National Results
Schools often have problems finding the Disadvantaged national results and so they are provided below:
| Description | Download |
|---|---|
| 360 Review Module - Teachers' Standards | Download |
| 360 Review Module - Wellbeing | Download |
| CPD Module | Download |
| T&L Module | Download |
| PM Module - Appraiser/Coach Guide | Download |
| PM Module - Appraisee/Coachee Guide | Download |
| Introducing Professional Development Notes | Download |
| Adding Professional Development Notes | Download |
| Addressing Professional Development Notes | Download |
| Form Name | Download Link |
|---|---|
| Book Bingo Monitoring Sheet | Download |
| Book Review | Download |
| Book Sample Form | Download |
| Formal Lesson Observation | Download |
| Learning Environment Review | Download |
| Learning Walk V1 | Download |
| Learning Walk V2 | Download |
| Tutorial Learning Walk | Download |
| Teacher Standards Lesson Obvservation | Download |
| Teaching and Learning Health check | Download |
| Work Scrutiny | Download |
| Whole School Lesson Review | Download |
| Work Scrutiny Feedback Form | Download |
The national data was provided by SFR 69/2017 (KS2 national results) and SFR 49/2017 (KS1 national results).

