Ofsted has been very vocal recently about the disjointed nature of MATs, both in terms…
Early Years Foundation Stage Results – 2018
The Department for Education (DfE) published their Early Years Foundation Stage (EYFS) statistics in October 2018. Nationally results for 2018 were positive and demonstrated steady improvement again on the previous year.
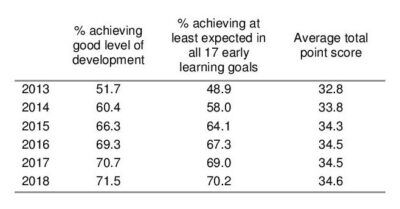
As demonstrated above results in all three key measures rose nationally with 71.5% of pupils achieving a good level of development compared to 70.7% the year before. There was a more modest increase for those achieving at least expected in all 17 early learning goals (70.2% compared to 69.0% for 2017). This was also the case for the average total point score which was up to 34.6 compared to 34.5 in 2017. Pupils eligible for free school meals (FSM) continued to perform worse than their peers with only 57% achieving a good level of development compared to 74% for those not eligible (a 17 percentage point difference).
What is most noticeable across all measures, and all statistics in general though, is the improvement in performance since 2013, as exemplified by the above table.
In terms of performance across the genders girls continue to perform better than boys in all of the 17 early learning goals and the key measures. The graph below shows the percentage of children achieving at least the expected level in each of the early learning goals by gender.
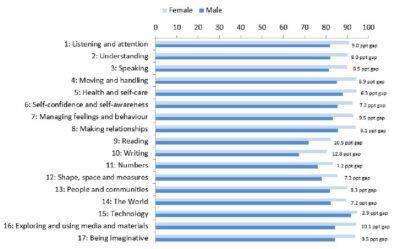
As we can see the biggest gaps are in writing, reading, and exploring and using media and materials. The smallest gap is for technology. FSM pupils on average achieved at least the expected standard 9pp worse than their peers. The biggest gaps here were in numbers (-20 percentage points), writing (-17 percentage points), and shape, space and measures (-15 percentage points).
Despite girls continuing to outperform boys the gender gap against the three key measures continued to decrease. This was due to boys’ performance continuing to improve at a faster rate than girls from 2013 to now. For example, the gender gap in percentage points for those achieving a good level of development has gone from 16.0 in 2013 to 13.5 in 2018.
Further information and statistics are available from the DfE here.
For Schools Education Services provide a range of data reports and analysis to help interpret your own school’s performance and attainment. These include summer reports produced as soon as pupil results are available to you, and autumn ASP reports based on DfE released data.