Coaching for staff development has become a key concept in many schools. When managed correctly…
Multi Academy Trust – MAT Performance Measures 2017 – Secondary
At the end of January 2018, the DfE published data about MAT performance.
Only those MAT’s with at least 3 state-funded, mainstream schools in the same phase, where the schools had been part of the MAT for 3 full academic years were included in the published data. This meant 62 MATs were included in the KS4 data, representing 384 individual schools and 54,356 Y11 students (10% of the national Y11 cohort).
Progress 8, EBacc entry rates and attainment were used for the MAT performance measurement. The MAT scores were weighted measures. The calculation of the scores was done at pupil level (giving more weight to large schools with more pupils) and also took account the length of time the academy had been working the trust and therefore benefiting (or not) from the MAT’s school improvement activities. Schools that were in the MAT 3 full years are weighted 3 whilst those in the MAT for 4 or more are given a weighting of 4.
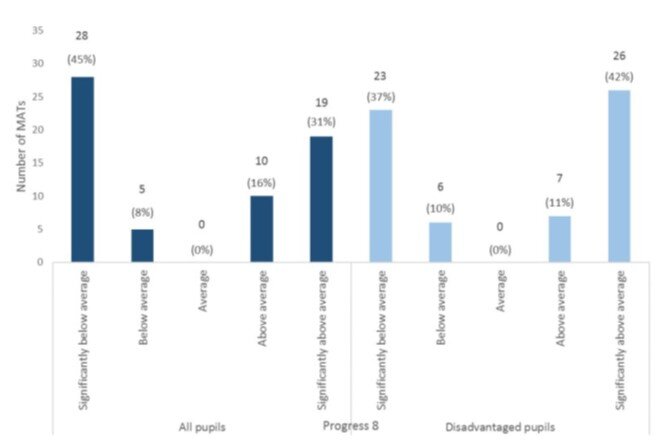
For each measure, the performance of the MAT falls into 1 of 3 categories: significantly above average (sig+); close to average; significantly below average (sig-). The average being the national average for all state-funded mainstream schools.
The number of MATs with Progress 8 scores below average is lower than 2016 when around two thirds of MATs had below average progress. However, the number of MATs included in the key stage 4 measures has increased by 32% from 47 in 2016 to 62 in 2017. This means that the change over time is likely to partly be a result of the change in the size and composition of this group. Changes over time may become more comparable as MATs stabilise in size and mix in future. In 2017, 45% of MATs performed significantly below average. This compares with 37% of MATs performing significantly below average for disadvantaged pupils.
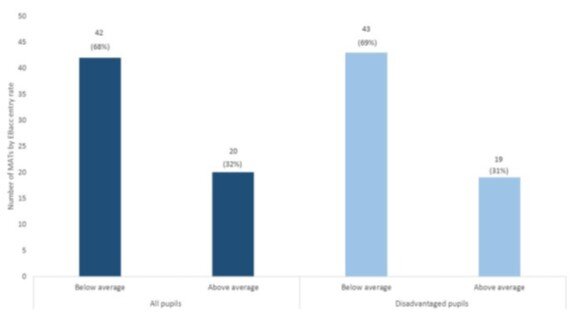
In 2017, 32.3% and 30.6% of MATs have EBacc entry above the national average for all pupils and for disadvantaged pupils respectively.
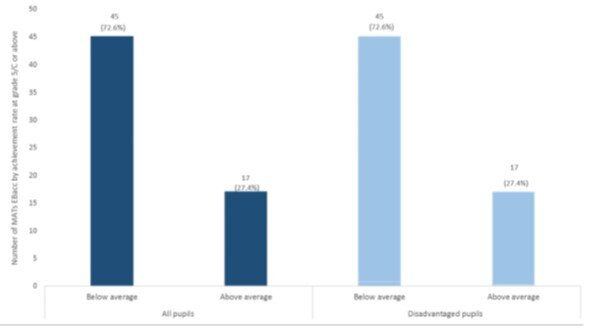
EBacc attainment for all pupils showed that 27.4% of MATs had achieved above the national average at grades 5/C or above for state-funded mainstream schools. The same percentage 27.4 % was true of disadvantage pupils who achieved at grades 5/C or above for state funded mainstream schools.
The document correctly points out that given the changing dynamics in MATs some caution needs to be applied when reading the data. For example, a relatively small MAT that sponsors a failing school is likely to see a negative impact on scores. Nevertheless, the document does give some useful information and there may be benefit in using it to help inform some higher level targets.
The full document on MAT performance can be found here.