Coaching for staff development has become a key concept in many schools. When managed correctly…
KS5 – Revised A Level and Other 16-18 Results in England, 2016/2017
SFR03 2018 provides an update on the provisional statistics published in October 2017 for A level and other 16-18 results, it includes 16-18 performance measures broken down by students’ disadvantaged status at the end of key stage 4 for the first time.
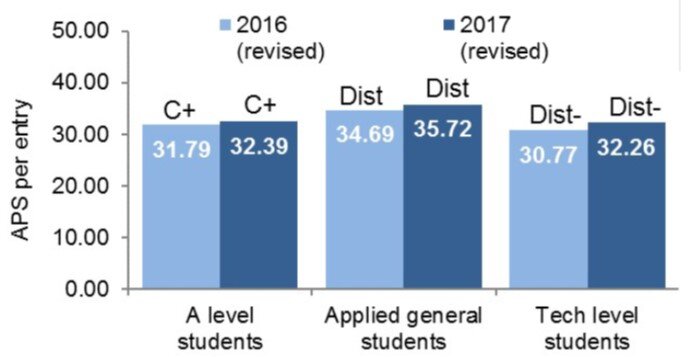
The average point score (APS) per entry increased for A level, applied general and tech level students, compared to equivalent 2016 revised data. The APS per entry expressed as a grade remained stable for all cohorts.
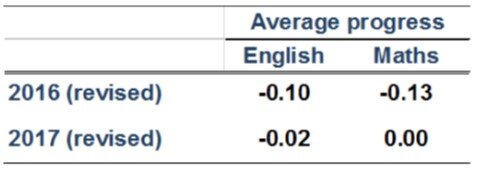
The English and maths progress measure looks at attainment in these subjects at the end of 16-18 study, compared to attainment at the end of key stage 4 (KS4), for students who did not achieve A*-C. In 2017, average progress is close to zero for students still studying GCSE or stepping stone qualifications. This means on average a student’s point score is the same or slightly lower at the end of 16-18 studies than at the end of KS4.
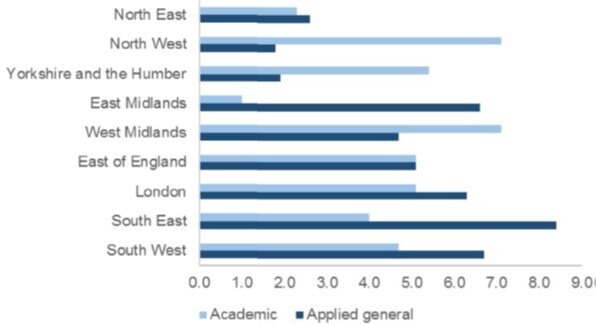
Of the total number of 16 to 18 providers assessed, 4.9% and 5.2% had value added progress scores that fell below the minimum standards set by the department for level 3 academic and applied general qualifications respectively, meaning these providers are seen as underperforming when compared nationally against other providers. There is wide variation at regional level.
A full analysis of the national KS5 data is available in SFR 03/2017 here.