Ofsted has been very vocal recently about the disjointed nature of MATs, both in terms…
Key Stage 2 Results – 2018
The Department for Education (DfE) publishes their revised statistics for key stage 2 (KS2) national curriculum assessments in December 2018. So, what are the headlines?
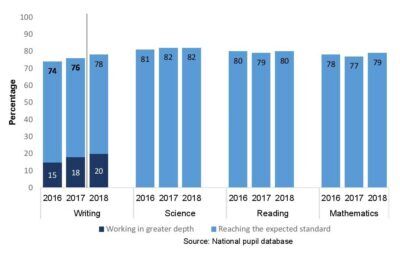
In 2018 64% of pupils reached the expected standard in all of reading, writing and maths, while 10% of pupils reached the higher standard. This was up from 61% and 9% respectively in 2017. Attainment by subject is shown below, though it must be noted that due to the changes to writing teacher assessment (TA) frameworks not all judgements are directly comparable.
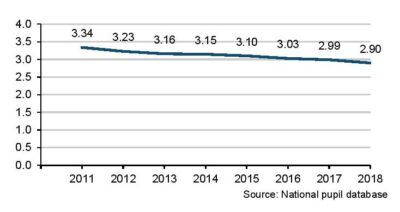
The attainment gap between disadvantaged pupils and others, using the disadvantage gap index, continued to decrease. In fact there has been a steady decline for the last seven years.
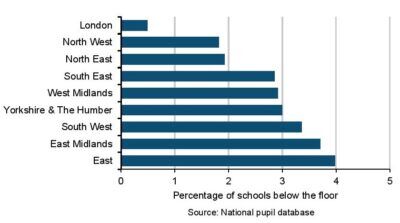
In terms of school performance (state-funded mainstream only) 364 (3%) were below the primary school floor standard. This was a decrease on 2017 numbers when 511 (4%) were below the standard. The chart below shows a regional breakdown of schools falling below the floor standards.
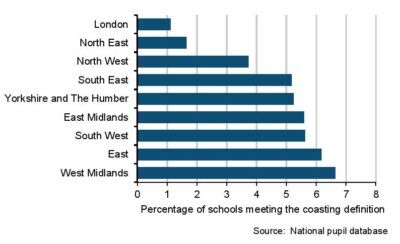
Finally looking at schools’ performance against the coasting definition there was an overall increase in the number of schools that met the coasting definition criteria. In 2018 640 schools met the criteria, equivalent to 5% of schools included in the coasting calculation. This was compared to 524 (4%) of schools identified in 2017 and 477 (3%) in 2016. The chart below shows a regional percentage breakdown for schools meeting the coasting definition.
Further information and statistics are available from the DfE here.
For Schools Education Services provide a range of data reports and analysis to help interpret your own school’s performance and attainment. These include summer reports produced as soon as pupil results are available to you, and autumn ASP reports based on DfE released data.